Hi, I'm Mustika

"I want to help others to make the right decisions, data-driven decisions"
Connect with me on LinkedIn.

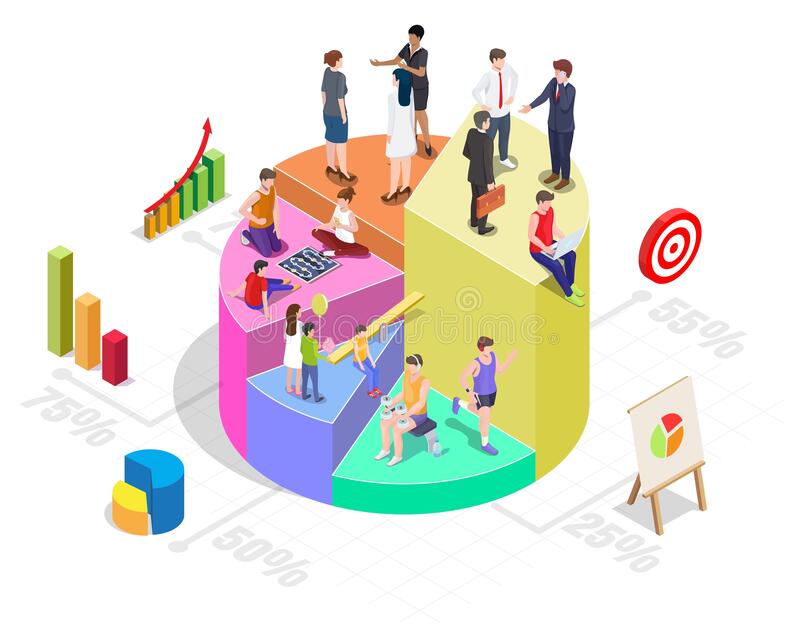
Redevelop Business Performance Management by creating KPI dashboard. The dashboard are able to be utilized as performance monitoring and not one time analysis only. The management could easily compare the growth, the difference from current position to previous period.
The dashboard includes:
- Top Level Management (C-Level Strategic)
- Middle Level Management (Manager Analytical)
- Operational Level Management (Staff Operational)
Differentiate marketing strategy towards different segment to maximize the customers. Conduct customer segmentation analysis using K-Means Clustering Method to know the characteristics of each segment and utilize their behavior to improve the performance.
Variable includes:
- Recency
- Frequency
- Monetary
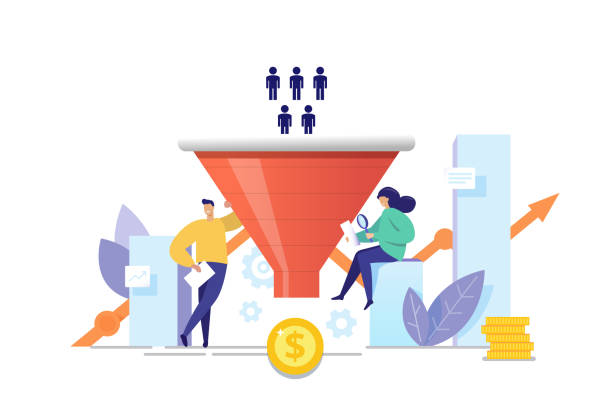
Decrease duration and bounce rate at each step, improve general conversion, decrease cart abandonment rate, and other important metrics.
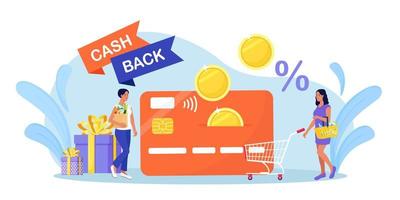
Evaluate the performance of voucher whether it is success or not. Find out if voucher has encourage user to transact, which type of voucher has the best performance and analyze deeper into utilization rate of the transactions, how is the impact to the customer segmentation and other dimensions.
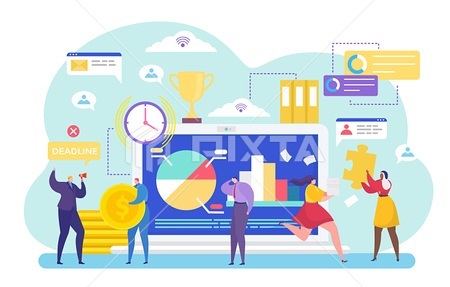
Analyze overall company conditions and find out if there is any change in customer behavior in the company in terms of spending habit, price group, payment method, product category, or other dimensions. Including cohort analysis and customer churn analysis.
Airbnb has become a common ground for people to seek housing. The abundant of empty properties become a new potential income for people. The original site offers short-term living quarters, breakfast and a unique business networking opportunity for attendees who were unable to book a hotel in the saturated market.
With overly saturated market, we over this guidebook for you to follow!

Prior to annual board meeting, the data team is requested to prepare evaluation of XYZ Store’s overall performance.
Including:
- Overall performance of XYZ Store sales
- Find out the problem and root cause
- Recommendation to improve the performance of XYZ Store sales
This dataset represents vending machine data from various locations in Central New Jersey. The locations include a library, a mall, office location and a manufacturing locations. Data analyst can make use of the data to understand trends, user behavior and overall preferences by consumers at different locations.
Including:
- Comprehensive report of the sales and other important findings
- Customer behavior analysis
- Location and Product that have most contribution and least contribution

Creating data visualization about Movie and TV Shows dataset using Google Data Studio and Tableau

Creating data visualization about Covid 19 World Vaccination Progress using Tableau

Increase the marketing conversion rate by doing more targeted marketing using customer segmentation and provide business recommendation.

Solve various business problem on bigquery using SQL.